Real Estate
Best of both worlds
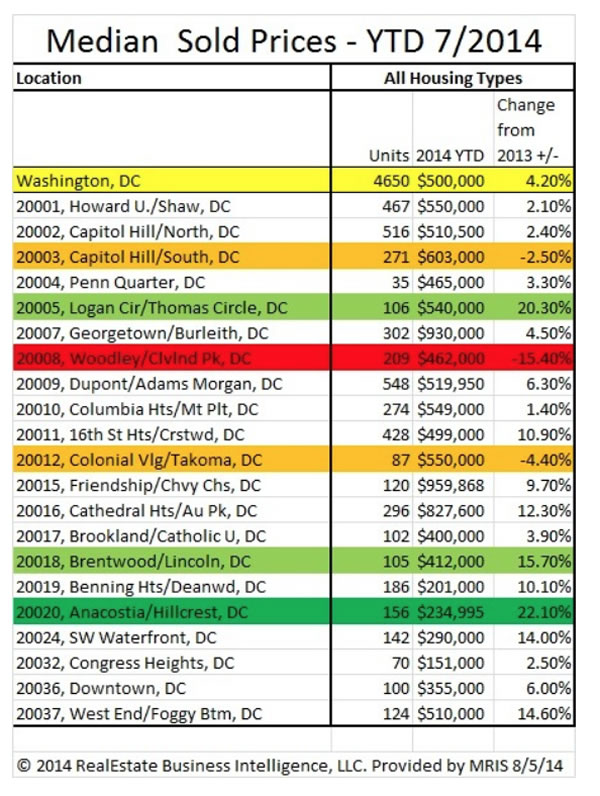
Where to look in D.C.? Depends what kind of house you want

Last month we looked at median prices over the past seven months for D.C. neighborhoods based on zip code and compared the growth in median price year to date for 2014 over that from 2013.
D.C. OVERALL
Using the year-to-date Washington overall 4.20 percent growth in median prices from 2013 to 2014 as our baseline, we looked at the statistics for individual neighborhoods based on zip code. The biggest winners for the year to date in median price growth are 20020 (Anacostia/Hillcrest +22.10 percent), 20005 (Logan Circle/Thomas Circle +20.30 percent), and 2018 (Brentwood/Lincoln +15.70 percent). Biggest losers in median price growth for the year overall are Woodley Park/Cleveland Park (-15.40 percent), 20012 (Colonial Village/Takoma DC -4.40 percent), and 20003 (Capitol Hill South -2.50 percent).
MEDIAN SOLD PRICE BY ATTACHED HOUSING TYPE
In this month’s article, we take a deeper look at median prices in neighborhoods by zip code in terms of housing type. We’ll look at attached housing, since that is the prevalent type of housing within the District, and we’ll look at it in terms of the following configurations: condos and coops, two bedrooms or fewer, three bedrooms, and four bedrooms or larger. In any configuration, we’ll rule out data for which there are fewer than five units or less sold in that configuration. Using this approach, we can identify some neighborhoods where the seller’s market still predominates (neighborhoods with larger increases in median sold prices) and neighborhoods where buyers might seek some less expensive housing (zip codes with lower increases or even decreases in median sold prices over 2013).
What’s the implication of all this number crunching? If you hear the market is “hot” in a certain neighborhood, make sure it’s hot in the housing type you want to sell. If you hear that there are bargains to be had, make sure those bargains are available in the type of housing you’re looking to buy. A good realtor will help you dig a little deeper to understand the market conditions for your existing or desired property.
NOTE: To view the actual numbers in the following paragraphs about median prices for different housing types, please refer to the chart at the end of the article.
CONDOS and COOPS MEDIAN SOLD PRICES: ANACOSTIA and HILLCREST MORE THAN DOUBLE; CONGRESS HEIGHTS OFFERS BUYER OPPORTUNITIES
Let’s start with condos and coops, since that is the by far the prevalent type of “attached” housing in the District. There have been 2,235 condo or coop units sold through July of this year, which represents 134 percent of the other kinds of attached housing.
Biggest increase with +127.91 percent is zip code 20020 (Anacostia/Hillcrest), which as we saw last month is the biggest gainer in overall median price for any housing type. Zip code 20010 (Columbia Heights, Mt. Pleasant) follows close behind at +90 percent, which testifies to the increasing development and demand for properties in this neighborhood. Zip code 2012 (Colonial Village/Takoma) is in distant third place at +38.59 percent. Interestingly, this same zip code is one of the lowest three zip codes for overall median price growth, which demonstrates the value of considering these numbers on a more discriminating basis.
Places where buyers might seek lower prices? Zip code 20032 (Congress Heights), with -18.04 percent decrease in median sold price since last year, zip code 20015 (Friendship Heights/Chevy Chase DC with -11.35 percent decrease), and zip code 20004 (Penn Quarter with -8.57 percent decrease).
ATTACHED HOUSES OF 2 BEDROOMS OR FEWER: 16th ST. HEIGHTS AND CRESTWOOD LEAD THE SELLERS’ PACK; BUYER BARGAINS IN BROOKLAND
At 331, attached homes of two bedrooms or less make up the smallest number of housing units sold.
In this configuration the biggest increases in median prices occurred in zip code 20011 (16th St. Heights/Crestwood with +64.01 percent), followed by zip code 20032 (Congress Heights with +35.50 percent) and zip code 20001 (Howard U/Shaw with +31.97 percent). Note the occurrence of zip code 20032 in both the lower rank for condos and coops, but the higher rank for one-to-two bedroom — so it depends what type of housing you’re looking for in selecting a neighborhood for good value.
In the same way, zip code 20017 (Brookland/Catholic U) is a great place to buy an attached two-bedroom home, as is zip code 20016 (Cathedral Heights/AU Park). Zip code 20010 (Columbia Heights/Mt. Pleasant is likewise a great place to buy an attached two-bedroom home, but a great place tosell that condo you’ve been living in since you arrived in D.C. (Sounds like a good move-up strategy: sell high and buy low.)
THREE-BEDROOM ATTACHED HOUSES: BRENTWOOD AND LINCOLN HAVE NEAR 50 PERCENT GROWTH IN MEDIAN SOLD PRICES; FRIENDSHIP HEIGHTS DECLINES
Three-bedroom attached homes make up the largest group of attached housing. At 789 units sold year to date, they make up almost half of the 1,658 attached housing units sold.
Zip code 20018 (Brentwood/Lincoln) was the big winner here, with an increase of +47.38 percent in median sold price over last year. Note that this zip code was also in the higher rank of D.C. neighborhoods overall for median price growth over 2013. Similarly, zip codes 20032 (Congress Heights) and 20001 (Howard U/Shaw) were in the higher rank for median sold price growth as they were for attached homes of one-to-two bedrooms. So these are clearly growth areas for attached housing.
Where are the potential bargains for buyers seeking three-bedroom attached housing? Some of the same neighborhoods emerge as in previous housing configurations: zip codes 20015 (Friendship Heights/Chevy Chase DC) and 20017 (Brookland/Catholic U). A surprise in this category is zip code 20009 (Dupont/Adams Morgan) with only 1.66 percent increase in median sold price over last year. But at $948,305, the median sold price may well be peaking and can hardly be considered a bargain.
ATTACHED HOUSING OF FOUR-PLUS BEDROOMS: BROOKLAND FOR SELLERS, FRIENDSHIP HEIGHTS FOR BUYERS
Attached homes of four bedrooms or more account for about one-third of the attached housing units sold.
Considering the data for attached housing of four bedrooms or more again demonstrates the wisdom of considering the housing type and configuration when evaluating seller’s dreams and buyer’s bargains — because some of the same zip neighborhoods emerge in opposite rankings from where we have previously seen them. Zip codes 20017, 20016, and 20011 emerge as good zip codes in which to sell, while zip codes 20015, 20008 and 20020 emerge as good places to buy a four-bedroom attached home.
[cincopa A8CAX9716K4Z]
Ted Smith is a licensed REALTOR® with Real Living | at Home specializing in mid-city DC. You can reach him at [email protected] and follow him on Facebook, Youtube or Twitter. You can also join him on monthly tours of mid-city neighborhood Open Houses, as well as monthly seminars geared toward first-time home buyers. Sign up at meetup.com/


In September 2024, I wrote about the District’s Lead-Free D.C. initiative, an ambitious effort to remove lead pipes and make drinking water safer for every resident in our city. Since that original article, a number of important developments have taken shape that affect everyone living in the District. Key drivers in the legal landscape surrounding this issue such as disclosure, testing, and infrastructure planning have been sharpened. The city’s sweeping pipe replacement efforts are continuing to evolve against the backdrop of broader federal drinking-water rules and funding changes.
What was once largely public health conversation for the future is now a practical reality for many property owners and renters. The water service line replacement project has moved from planning and is presently underway throughout the city.
Elevated levels of lead in drinking water is a perplexing challenge in many U.S cities. Researchers documented elevated lead levels in D.C.’s water system more than two decades ago, spotlighting how old infrastructure can pose a hidden health risk even in one of America’s wealthiest cities. Local leaders responded with pipe replacement plans that have continued in the years since.
The Lead-Free D.C. initiative remains the central effort to reduce that risk by replacing water supply lines. These are the pipes that carry water to your home or rental property from the street. D.C. Water estimates that tens of thousands of lead or galvanized service lines still exist in the city and must be systematically replaced to eliminate this exposure.
What Has Changed Since September 2024
Over the past 18 months, several shifts have rippled through policy, practice, and the daily experience of both landlords and tenants:
- Local Disclosure and Tenant Rights: The city has strengthened disclosure requirements. Today, property owners are expected to provide clear written disclosures about known lead service lines, any testing that has been done, and records of past replacements. Tenants also have the right to request lead testing of their tap water, and landlords are responsible for ordering and passing along the test kit, and are required by law to share results with tenants when requested.This reflects an ongoing push toward transparency and an informed occupancy.
- Pipeline Replacement Planning: D.C. Water and the District Government are continuing to roll out their block-by-block lead service line replacement work, with construction schedules publicly available through a Lead-Free D.C. construction dashboard. The goal is to remove by 2030 all lead service lines on both the public and private side, though timelines and funding mechanisms are still being refined as the work continues. D.C.’s Lead-Free DC initiative stipulates that DC Water is responsible to replace the public portion of a lead service line at no cost to the property owners. This is the section running from the water main under the street to the property owner’s lot line. When DC Water is already replacing the public side as part of a scheduled infrastructure project, it will also offer to replace the private-side service line (into the building) at no cost to the owner, as long as the owner grants access and signs a right-of-entry agreement. In these cases, DC Water pays the contractor directly, and the entire lead service line is removed in one coordinated effort.
When no public-side project is scheduled, owners may still qualify for full private-side replacement coverage through the District’s Lead Pipe Replacement Assistance Program (LPRAP). If approved, the program covers the cost of replacing the private-side lead pipe, with funds paid directly to the contractor. Property owners are typically responsible for selecting the contractor, coordinating the work, and covering any costs outside the approved scope of work. Funding is subject to availability, and eligible applicants may be placed on a waiting list depending on annual program budgets.
- Implementation Best Practices: To avoid challenges and misunderstandings regarding the responsibilities during such a significant undertaking, fully investigating the program and how it works is a good first start as is regular and clear communications.
It’s helpful for both property owners and residents to have a clear understanding of what D.C. Water and construction crews will be doing during a lead service line replacement and what follow-up work may remain once the project is complete. Like any major infrastructure upgrade, the process can involve temporary water shutoffs, excavation around the building, and some restoration afterward, such as repairing landscaping or sections of sidewalk. While these short-term disruptions can be inconvenient, they’re a normal and necessary part of modernizing the city’s water system and ensuring safer drinking water for the long term.
- Federal Drinking Water Rules: On the national stage, the U.S. Environmental Protection Agency (EPA) finalized in October 2024 the Lead and Copper Rule Improvements (LCRI). The LCRI requires public water systems across the country to inventory and plan to replace lead service lines, and to remove all lead pipes within about a decade. It also strengthens testing, monitoring, and public notification requirements and lowers the action level for lead exposure, building on earlier revisions to the Lead and Copper Rule.
While these federal changes do not rewrite Washington, D.C.’s specific legal requirements for landlords and tenants, they do help shape funding opportunities, compliance expectations, and the broader national push to eliminate lead plumbing, which can affect utilities, state programs, and local infrastructure planning.
Federal drinking water regulations are subject to administrative review, litigation, and potential revisions as presidential administrations change. While the EPA’s 2024 Lead and Copper Rule Improvements remain in effect as of this writing, aspects of implementation, enforcement timelines, or funding mechanisms may evolve through future rulemaking, court decisions, or congressional action. These federal rules do not override Washington, D.C.’s independent authority to adopt and enforce its own public health, housing, and water safety requirements, which continue to govern landlord and tenant obligations within the District regardless of federal regulatory shifts.
What Landlords Should Know
For landlords in D.C., these evolving expectations matter in 3 key ways:
- Disclosure Is Now a Must: You are expected to provide prospective tenants with upfront information about lead service lines, known test results, and replacement history before lease signing. Existing tenants must also be informed if you learn anything new about the plumbing system.
- Testing Should Be Welcomed, Not Avoided: When tenants request a lead water test, you’re now required to provide D.C. Water’s approved kit and cooperate with the process. The test results give both sides clear information about water quality and whether additional remediation is advisable.
- Capital Investment May Be Unavoidable: Even if much of the public-side work is funded by D.C. Water, private-side service line replacement costs and restoration work may still fall to the property owner if the home still has lead service lines. Planning for both the expense and the logistics is key to be able to take advantage of this program being offered to D.C. homeowners.
What This Means for Tenants
For renters, the changes bring clearer rights and fewer unknowns. Tenants no longer have to guess whether lead pipes serve their home; they can request testing, receive timely results, and rely on official disclosures when deciding where to live and how to protect their health.
Transparent communication with the landlord, responsiveness to testing requests, and participation in replacement programs turn regulatory requirements into real-world safeguards. In that way, landlord action directly shapes tenant trust, housing stability, and long-term public health outcomes.
At a moment when the District is investing heavily in its infrastructure, landlords who plan ahead and participate help to ensure that these public resources translate into safer housing, stronger neighborhoods, and a city better equipped for the future.
Why This Still Matters
Lead-free water shouldn’t be a luxury. Continued investment by federal and local governments in Washington, D.C.’s water infrastructure reflects a shared commitment to the city’s long-term health and livability. Modernizing service lines helps ensure that people can raise families here, age in place, and remain part of their communities without the added health concerns associated with lead exposure.
Landlords who take the time now to understand, disclose, and plan for lead service line replacement not only comply with evolving expectations, but they also strengthen the long-term value and marketability of their properties.
Scott Bloom is owner and senior property manager of Columbia Property Management.

As the days grow longer and buyers re-emerge from winter hibernation, the spring market consistently proves to be one of the strongest times of year to sell a home. Increased inventory, motivated buyers, and picture-perfect curb appeal make it a prime window for homeowners ready to list.
The good news? Preparing your home for spring doesn’t require a full renovation or a contractor on speed dial. A few thoughtful, cost-effective updates can dramatically elevate your home’s appeal and market value.
Here are smart, inexpensive ways to get your property market-ready:
Fresh Paint: The Highest Return on a Small Investment
Few improvements transform a home as quickly and affordably as paint. Neutral tones remain the gold standard, but today’s buyers are gravitating toward warmer tan hues that create an inviting, elevated feel without overwhelming a space. Soft sandy beiges and warm greige-leaning tans provide a clean backdrop that photographs beautifully and allows buyers to envision their own furnishings in the home.
Freshly painted walls signal care and maintenance — two qualities buyers subconsciously look for when touring properties.
Removable Wallpaper: Style Without Commitment
For homeowners wanting to introduce personality without permanence, removable wallpaper offers a stylish solution. A subtle textured pattern in a powder room, a soft botanical print in a bedroom, or a modern geometric accent wall can add depth and character. Because it’s easily removed, it appeals to both sellers and buyers — creating visual interest without long-term risk.
Upgrade Light Fixtures for Instant Modernization
Outdated lighting can age a home instantly. Swapping builder-grade fixtures for modern, streamlined options is one of the simplest ways to refresh a space. Consider warm metallic finishes or matte black accents to create a cohesive, updated look. Proper lighting not only enhances aesthetics but also ensures your home feels bright and welcoming during showings.
Elevate Curb Appeal: First Impressions Matter Most
Spring buyers often decide how they feel about a home before they ever step inside. Refreshing curb appeal doesn’t require major landscaping. Simple updates such as fresh mulch, trimmed shrubs, seasonal flowers, a newly painted front door, and updated house numbers can dramatically improve first impressions. Power washing the driveway and walkways also delivers a clean, well-maintained appearance for minimal cost. Even if you don’t have a curb to appeal- think potted plants on your patio, balcony and change out your door mat.
Deep Clean & Declutter (Seriously, It Matters)
A deep, top-to-bottom cleaning is basically free and one of the most impactful things you can do. Scrub floors, windows, grout, baseboards, appliances, bathrooms, and everything in between. Don’t forget to clean windows inside and out — natural light is a huge selling point. Declutter by packing up excess stuff, clearing off countertops, and minimizing personal items so buyers can see the space, not your life.
Let the Light Shine
Make your home feel bright and inviting by cleaning windows, opening blinds, and replacing dark or dated light fixtures with contemporary, budget-friendly options. Swapping in LED bulbs offers brighter light and lower utility costs — a small change that buyers appreciate. Pro tip: I always recommend removing widow screens to allow as much light in as possible
Neutralize Scents
Make sure the home smells fresh. Neutralizing odors — whether from pets, cooking, or moisture — creates a clean, welcoming atmosphere. Light natural scents like citrus or subtle florals can be inviting during showings. Think of how your favorite hotel smells and go for that.
Spring market rewards preparation. By focusing on high-impact, low-cost improvements, sellers can position their homes to stand out in a competitive environment. With thoughtful updates and strategic presentation, homeowners can maximize both buyer interest and potential sale price — all without overextending their renovation budget.
As activity increases and inventory begins to rise, now is the time to prepare. A little polish today can translate into significant results tomorrow.
Justin Noble is a Real Estate professional with Sotheby’s International Realty Servicing Washington D.C., Maryland, and the beaches of Delaware.
Real Estate
2026: prices, pace, and winter weather
Lingering snow cover, sub-freezing temperatures have impacted area housing market

The D.C. metropolitan area’s housing market remains both pricey and complex. Buyers and sellers are navigating not only high costs and shifting buyer preferences, but also seasonal weather conditions that influence construction, inventory, showings, and marketing time.
Seasonality has long affected the housing market across the U.S. Activity typically peaks in spring and summer and dips in winter; however, January and February 2026 brought unusually cold spells to our area, with extended freezing conditions.
Persistent snow and ice-covered roads and sidewalks have gone for days, and in some cases weeks, before melting. While snow accumulation normally averages only a few inches this time of year, this winter saw below-normal temperatures and lingering snow cover that has significantly disrupted normal activity.
Rather than relying on neighborhood teenagers to shovel snow to make some extra money, the “snowcrete” has required ice picks, Bobcats, and snow removal professionals to clear streets and alleys, free our cars from their parking spaces, and restore availability of mass transit.
These winter conditions have had an adverse impact on the regional housing market in several ways.
- Construction slowdown: New builds and exterior improvements often pause during extended cold, resulting in delayed housing starts when we need affordable housing in the worst way.
- Listing preparation: Cleaning crews, sign installers, photographers, and stagers with trucks full of furniture may be unable to navigate roads and need to postpone service.
- Showings and open houses: Simply put, buyers are less inclined to schedule visits in hazardous conditions. Sellers must ensure walkways and parking areas are clear and de-iced and be able to vacate the property while viewings are taking place.
- Inspection and appraisal delays: Like buyers and sellers, ancillary professionals may be delayed by unfavorable weather, slowing timelines from contract to close.
- Maintenance and repairs: Properties with winter damage (e.g., ice dams or frozen pipes) may experience repair delays due to contractor availability and supply chain schedules. Snow and cold can also affect properties with older and more delicate systems adversely, leading some sellers to delay listing until better conditions arrive.
- Availability of labor: Increasingly, construction, landscaping, and domestic workers are reluctant to come into the District, not because of ice, but because of ICE.
Overall, the District has shown a notable increase in days on the market compared with past years. Homes that once sold in a week or less are now often listed for 30+ days before obtaining an offer, especially in the condominium and mid-range house segments. While part of this shift can be attributed to weather and climate, interest rates, uncertain employment, temporary furloughs, and general economic conditions play key roles.
Nonetheless, we continue to host some of the region’s most expensive residences. Historic estates, including a Georgetown mansion that sold for around $28 million, anchor the luxury segment and reflect ongoing demand for premium urban property.
But even in this high-end housing sector, marketing strategies are evolving based on seasonal realities. Price reductions on unique or niche properties, such as undersized or unconventional homes, reflect a broader market adjustment where competitive pricing can shorten selling time.
For example, a beautifully renovated, 4-story brick home with garage parking and multiple decks that overlook the Georgetown waterfront sold in early February for 90 percent of the list price after 50 days on the market.
At the other end of the spectrum, a 2-bedroom investor-special rowhouse in Anacostia only took eight days to sell for under $200,000, down 14 percent from its original list price. In addition, four D.C. homes took more than 250 days to sell, including an 8-bedroom rooming house that was on the market for 688 days and closed after a 23 percent downward price adjustment.
Some frustrated sellers are simply taking their homes off the market rather than dropping prices below their mortgage balances, although we are beginning to see the resurgence of short sales for those who must sell.
Condominiums and cooperatives offer many opportunities for buyers and investors, with 1,100 of them currently on the market in D.C. alone. List prices run the gamut from $55,000 for a studio along the Southwest Waterfront to nearly $5 million for five bedrooms, four full baths, and 4,400 square feet at the Watergate.
So, while Washington metro area prices remain high, the pace of sales now reflects both seasonal and economic realities. Homes taking longer to sell, in part caused by elements of winter, signal a shifting market where buyers can take more time to decide which home to choose and have a better negotiating posture than in recent years.
Accordingly, sellers must continue to price strategically, primp and polish their homes, and prepare for additional adverse circumstances by reviewing fluctuating market conditions with their REALTOR® of choice.
Valerie M. Blake is a licensed Associate Broker in DC, MD & VA with RLAH @properties. Call or text her at (202) 246-8602, email her at [email protected] or follow her on Facebook at TheRealst8ofAffairs.

How Pepper the courthouse dog helps victims of abuse

Women’s FEST returns to Rehoboth Beach next week

Belarusian lawmakers approve bill to crackdown on LGBTQ rights

Calendar: April 3-9

How new barriers to health care coverage are hitting D.C.

‘Out for McDuffie’ event held at D.C. gay bar

Thousands attend ‘No Kings’ protests in D.C.

Ghanaian president welcomed to Philadelphia amid backlash over anti-LGBTQ bill

PHOTOS: ‘No Kings’ rally and march