Real Estate
Mid-City in winter
Winners and losers in the January 2014 real estate market

The big Mid-City winners in this category were zip code 20005 (Logan Circle) and 20004 (Penn Quarter). (Photo by AgnosticPreachersKid; courtesy Wikimedia Commons)
The books are closed on January 2014 real estate stats and, in general, it was a better month for market activity than January 2013. So let’s take a look at the numbers:
Mid-City statistics
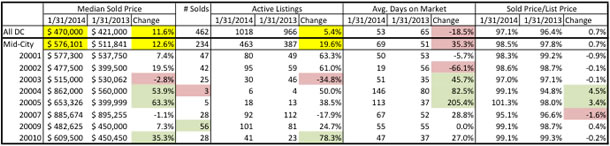
First, comparing median sold prices, Mid-City properties saw growth in median sold prices for January 2014 over January 2013 — $576,101 over $511,841. These figures are higher for both Mid-City and D.C. overall in either year; additionally, Mid-City median sold prices have a greater increase year over year than D.C.—by 12.6 percent compared to 11.6 percent for D.C. The big Mid-City winners in this category were zip code 20005 (Logan Circle) and 20004 (Penn Quarter), with 63.3 percent and 53.9 percent increases respectively. However, because these two zip codes had so few solds in January (a total of eight), it might be more accurate to designate zip code 20010 (Columbia Heights, Mt. Pleasant) as the winner with 28 solds and a 35.3 percent increase. The big loser was zip code 20003 (Capitol Hill, Navy Yards) with a -2.8 percent decrease in median sold prices over January 2013.
For active listings, Mid-City had a greater percentage increase in the number of properties on the market—from 387 in January 2013 to 463 in January 2014—for an increase of 19.6 percent in available properties in comparison to only a 5.4 percent increase for DC overall. Again, the big Mid-City zip code winner was 20010 (Columbia Heights, Mt. Pleasant) with a 78.3 percent increase in active listings, while the big loser was again zip code 20003 (Capitol Hill, Navy Yards) with a decrease of -34.8 percent in the number of active listings.
Average days on the market is one indicator of the “speed of the market” and a general index of the seller’s market: the fewer the number of days on the market, the more the market is considered to be a seller’s market. Here, D.C. showed an -18.5 percent decrease in average days on the market, while Mid-City experienced a 35.3 percent increase. This means there were more properties on the market for a longer time in January 2014 over January 2013 in Mid-City, but fewer in D.C. overall. However, to put this all in perspective, there must be a six-month supply of homes on the market for it to be considered a “balanced” market between sellers and buyers. Dividing the average days on the market by 30 to obtain the number of months of supply of available homes, we can see that both D.C. overall and Mid-City have approximately a two-month supply of homes on the market—making it clear that we are still in a seller’s market. (However, this figure is up from the fall season, when homes moved so quickly off the shelf that there was less than a one-month supply.)
Identifying winners and losers in this category depends on your point of view: if you are a seller, a lower number of days on the market is better because it means that there is less competition for your property; if you are a buyer, a greater number of days is better because it means you have more options from which to choose and sellers may be more willing to negotiate. So, for this category, winner/loser zip codes for sellers are 20002 (H Street, Atlas District, Trinidad) with a decrease of average days on the market of -66.1 percent over January 2013 and 20005 (Logan Circle) with an increase of average days on the market of 205.4 percent over January 2013. For buyers , the winner/loser zip codes are just the opposite: your buying options increased in zip code 20005, while they decreased in zip code 20002. Looks like the H Street district is heating up.
The final comparison is sold price/original list price. Here, what’s being compared is how big a percentage of the original list price sellers are getting. The higher the percentage, the more we are in a seller’s market. The D.C. market has been in the 90+ percentage range for the last five years—even through the modest real estate decline we experienced in the District. Bargains are few and far between in D.C., and this is something that newcomers trying to buy a home here frequently learn the hard way by losing a number of their first offers. In this category, there wasn’t much different between D.C. overall and Mid-City from January 2013 to January 2014: Both experienced a .7 percent increase in the ratio of sold price to original list price, with the Mid-City ratio of 98.5 percent being 1.4 percent higher than D.C.’s 97.1 percent. (This means that Mid-City homes sell for closer to asking price—surprise!) In this category, the big winners—at least from a seller’s perspective—were zip codes 20004 (Penn Quarter) and 20005 (Logan Circle), with 4.5 percent and 3.4 percent increases over January 2013. It’s worth pointing out that zip code 20005 had a sold price/original list price ratio of 101.3 percent. This means that Logan Circle properties are selling for more than their asking price—even in the dead of winter. How is that possible? It means that 20005 properties are receiving multiple contract offers.
And the big loser in this category? Zip code 20007 (Georgetown/Burleith, Glover Park), with a -1.6 percent decrease in the sold price/list price ratio to 95.1 percent. However, at a median sold price of $885,674, that’s hardly “loser” status.
Happy Hunting!
Ted Smith is a licensed Realtor with Real Living | at Home specializing in Mid-City DC. Reach him at [email protected] and follow him on Facebook.com/MidCityDCLife, Youtube.com/TedSmithSellsDC or @TedSmithSellsDC. You can also join him at free monthly seminars for first-time homebuyers or monthly tours of open houses in a different neighborhood each week. Sign up at meetup.com/DCMidCity1stTimeHomeBuyers/.





Real Estate
Factors to consider when hiring an interior designer
It’s essential to have confidence in the professionals you engage

(StatePoint) Ready to redesign your home? Whether you have only a vague notion of how you want your spaces to look or a very specific vision, relying on the expertise of a professional can help you bring your dream home to life. Before choosing and hiring an interior designer, though, be sure to take the following factors into consideration:
Style: Identify your style. Is it boho chic? Industrial? Maximalist? Many designers have their own signature look and preferences. It’s best to understand what vibe you want first, then search for a designer who aligns with that style.
Past client projects: One of the best ways to know whether a particular designer is the right fit for you is to review their past client projects. Ask to see their portfolio or review their finished projects on their website or socials. Also, take a look at reviews and testimonials to ensure their previous customers walked away satisfied with a job well done.
Budget: Communicate your budget in advance of work to confirm that you and your designer are on the same page financially. Your decorator will need this ballpark figure to get a handle on the scope of the project and to make design decisions accordingly. You should also use this conversation to understand their rates so you can decide whether you want to move forward.
Preferred vendors: It’s important that the interior designer you choose has preferred vendors that they work with. These are partners they’ve built strong relationships with that provide the same first-rate experience they do, and have streamlined processes in place. “A home renovation has so many moving parts. That’s why we try to take the hassle out of the process for designers and homeowners alike,” says Katie Zess, senior marketing manager and director of Renewal by Andersen’s Interior Designer Loyalty Program.
Through the loyalty program, the full-service window and door replacement division of Andersen Corporation offers their program members exclusive access and rewards, including a “designer discount” they can share with their clients. Renewal by Andersen also offers designers a dedicated point of contact to ensure a smooth process that’s customized for your project from start to finish. To learn more, visit renewalbyandersen.com.
Before you begin your home renovation, it’s essential to have confidence in the professionals you hire. Be sure your interior designer has fostered partnerships that will streamline your redesign, and that their goals and budget aligns with yours.
Real Estate
The LGBTQ real estate map is being redrawn
Affordability, higher mortgage rates reshaping where we choose to call home

For decades, the map of LGBTQ+ America was relatively easy to recognize.
New York. San Francisco. Los Angeles. Palm Springs. Provincetown. Fort Lauderdale and Wilton Manors.
These communities became LGBTQ+ destinations because they offered something that wasn’t always easy to find elsewhere: visibility, acceptance, community and the freedom to live openly.
But that map is changing.
Today’s LGBTQ+ homebuyers are navigating a housing market defined by high prices, elevated mortgage rates and affordability challenges. At the same time, remote and hybrid work, retirement and the growth of LGBTQ+ communities beyond traditional destinations are giving buyers more choices about where to live.
Increasingly, the question isn’t simply, “Where are the most LGBTQ-friendly places to live?”
It’s also: “Where can I find community and afford the life I want?”
That shift may become one of the defining LGBTQ+ real estate trends of the coming decade.
Affordability Is Changing the Conversation
For many buyers, the biggest issue in today’s housing market is simple: the monthly payment.
The average 30-year fixed mortgage rate was 6.95% in mid-September, compared with 6.26% a year earlier, according to Freddie Mac.
Meanwhile, the median price of an existing U.S. home reached $429,100 in August, according to the National Association of Realtors.
The combination of elevated home prices and higher borrowing costs has changed what many Americans can afford—and where they can afford it.
Some buyers are purchasing smaller homes or condominiums. Others are moving farther from major urban centers. Still others are reconsidering expensive markets entirely.
For LGBTQ+ buyers, this is helping broaden the definition of an LGBTQ+-friendly place to call home.
LGBTQ+ Buyers Have More Choices
A generation ago, relocating away from a major city or established gay neighborhood could sometimes mean sacrificing access to a visible LGBTQ+ community.
That’s increasingly less true.
Traditional LGBTQ+ destinations such as Palm Springs, Fort Lauderdale and Wilton Manors, San Francisco, New York and Provincetown remain important centers of LGBTQ+ life. But today, LGBTQ+ buyers can also find established or growing communities in cities across the country.
Places such as Minneapolis, Columbus, Pittsburgh, Richmond, Atlanta and the Tampa Bay area are among the markets attracting buyers who may be looking for a different balance of housing costs, lifestyle and community.
The goal isn’t necessarily to find the cheapest house.
It’s to find the right combination of affordability, LGBTQ+ community, lifestyle, employment opportunities, healthcare, culture and quality of life.
Remote and hybrid work have expanded those possibilities for some buyers. If a job no longer requires being in an expensive employment center five days a week, the geographic search for a home can become considerably larger.
That can make communities that once seemed impractical suddenly worth considering.
Retirement Is Redrawing the Map, Too
Retirement is another important part of the changing LGBTQ+ real estate landscape.
As more Americans reach retirement age, LGBTQ+ retirees are considering where they want to spend the next chapter of their lives. Housing costs, taxes, healthcare, climate and proximity to airports, restaurants and cultural activities all play a role.
But LGBTQ+ retirees may have additional questions.
Will I feel comfortable living openly?
Is there an LGBTQ+ community nearby?
Can I find LGBTQ+-affirming healthcare?
Will I have opportunities to build a social network as I get older?
Those considerations can make choosing a retirement destination particularly personal.
Palm Springs and Fort Lauderdale/Wilton Manors remain well-known LGBTQ+ retirement destinations. But retirees are also exploring smaller cities and communities across the Southeast, Midwest and other regions where housing costs and lifestyles can look very different.
For many, the search is becoming less about moving to a famous gay destination and more about finding a place where community, lifestyle and affordability intersect.
Buyers Finally Have More Leverage
There is another significant change in today’s housing market: buyers have regained some negotiating power.
The National Association of Realtors reported 1.62 million existing homes for sale in August, up 5.9% from a year earlier. That represents approximately 4.9 months of housing supply, the highest level in more than a decade.
Realtor.com also reported that 20.4% of active listings had experienced a price reduction in August.
That’s a very different environment from the pandemic-era housing market, when buyers in many communities faced bidding wars, waived inspections and offers well above asking price.
Depending on the market, today’s buyer may have more time to evaluate a property and greater opportunity to negotiate price, repairs, closing costs or other concessions.
But there is an important caveat: there is no single national housing market.
Conditions can vary dramatically from one city—or even one neighborhood—to another. Some markets remain competitive, while others have considerably more inventory and negotiating room.
That’s one reason local expertise matters.
Sellers Need a Different Strategy
The changing market also has implications for LGBTQ+ homeowners considering selling.
Strategies that worked several years ago may not work today.
Buyers are highly sensitive to monthly payments, and an overpriced home can quickly be passed over when competing properties are available.
Sellers should pay close attention not only to recent comparable sales but also to homes currently competing for the same buyer.
Condition matters, too.
Repairs, landscaping, staging and professional photography can make a meaningful difference when buyers have more choices. Pricing correctly from the beginning has also become increasingly important.
More Than 30 Years Serving the LGBTQ+ Community
One part of buying or selling a home hasn’t changed: the importance of working with a real estate professional who understands your priorities.
For more than 30 years, GayRealEstate.com has served the LGBTQ+ community, connecting buyers and sellers with LGBTQ+ and allied real estate professionals throughout the United States.
Over that time, the GayRealEstate.com network has supported more than $2 billion in real estate sales and more than 55,000 transactions.
Behind those numbers are thousands of people making one of life’s most personal decisions: where to call home.
For LGBTQ+ buyers, that conversation can involve much more than bedrooms, bathrooms and price per square foot. It can include community, acceptance, healthcare, family, retirement, lifestyle and the ability to live openly.
An experienced LGBTQ+ or allied real estate professional can understand why those considerations belong in the real estate conversation.
Finding Home in a Changing America
The 2026 housing market presents real challenges.
Mortgage rates remain elevated. Home prices are high. Affordability continues to strain buyers across much of the country.
But there are also signs of a more balanced market. Inventory has increased. Price reductions have become more common. Buyers in many markets have regained negotiating power.
And for LGBTQ+ Americans, something else has changed: there are more places to consider calling home.
The next great LGBTQ+ destination doesn’t necessarily need the country’s largest Pride celebration or its most famous gay neighborhood.
It could be a smaller city with a growing LGBTQ+ community, attainable housing, good healthcare, strong cultural amenities and a quality of life that leaves room for travel, retirement or simply enjoying the home you’ve worked hard to own.
Ultimately, today’s LGBTQ+ real estate search increasingly comes down to three questions:
Where can I afford the life I want?
Where will I find my community?
And where will I feel at home?
The answers are becoming more varied—and that’s helping redraw the map of LGBTQ+ America.
Scott Helms is with GayRealEstate.com.
GayRealEstate.com has served the LGBTQ+ community for more than 30 years, connecting LGBTQ+ homebuyers and sellers with LGBTQ+ and allied real estate professionals across the United States. Its network has supported more than $2 billion in real estate sales and more than 55,000 transactions.

One of the biggest headaches of the new home process is the actual moving part. By the time someone is buying a home, most people are beyond the “I just need a pickup truck, a pizza and a case of beer for my friends.”
If that is still someone’s preferred way to move, that’s great. However, many people find they need a much more robust plan. It can also trigger a lot of feelings about items one owns, what to do with them, do they have too much, should I keep this memento that I never use? Etc.
Moving is a chance for a person to “clean house” literally, figuratively, spiritually and energetically. A person can figure out which items they want to keep, and which need to go. As someone who recently moved across the country, I can speak to this experience. It’s also time for what people call “the fresh start effect.” This phenomenon, according to psychologists, can happen in little moments (like the start of a new work week) and bigger moments (such as moving from one home to the next).
The fresh start effect offers these benefits often mentioned by psychologists:
- Mental Accounting: Dates act as chapter breaks, letting you put past failures into a previous period.
- Psychological Distance: You separate your flawed past self from your aspirational future self (“That was the old me”).
- Optimism Boost: New beginnings clear mental clutter and increase your sense of agency and control
Does this mean that “the new you” will be the perfect version you envisioned? Probably not. We are humans. But it might mean you get a chance to “leave some of the old you behind” within the walls you used to live in, and now have a chance to have a new layout, a new décor, a new color pattern, new wallpaper, donate old furniture and books or magazines, throw out clothes you no longer use or fit in, and enjoy the opportunity to literally use the, “Does this spark joy?” method that was made so popular by Marie Kondo in her Netflix series.
So, for all its hassle and headache, moving is a chance to shake off the “old you” and try on the new you, to incorporate the items you would like to keep and use more of, and shed the items, habits, and ways of thinking that you feel no longer serve you.
I can speak to the experiences that several of my clients had when they moved from a previous residence to a newer one. It usually coincided with a change in relationship status, a change in employment, a change in family size, but sometimes it just seemed to correlate to a new attitude and perspective that the client was really hoping for.
I have literally had clients come to me after the fact, in tears, that they were so happy they made the decision to move out of a situation that no longer served them, and move into one that felt like a much better fit.
Change can be annoying and overwhelming at times, but usually most people come out the other side, not wanting to return to the way they were before.
Joseph Hudson is a referral agent with RLAH. Reach him at 703-587-0597 or [email protected].

Renee Good’s family files two federal lawsuits

House Democrats urge White House to confront Turkish government over anti-LGBTQ crackdown

988 restores crisis services for LGBTQ youth

To school to homeschool to school again

Ryan Murphy’s ‘Monster’ vilifies the lesbian

PHOTOS: HRC National Dinner

Factors to consider when hiring an interior designer

Dr. Fauci ‘honored to be part of’ LGBTQ history

Baltimore’s oldest gay bar to reopen this week